
I’ve found through my talks at different meetings typically 70-80% of those in attendance are using some type of CRM within their company. And that only 10% feel they are getting ROI out of their CRM. One of the factors that lead to success is setting the stage for WHY from the beginning…including getting management buy in.
Visibility is a key component in showing “why” you’ve chosen a CRM. Think about this…we all have visibility of the back end of our sales, via the ERP we are using to quote and process our orders. BUT, do we have visibility on the Front-End? This is where the CRM tool comes in to play and it is huge in helping to manage visibility of our leads and opportunities.
One of the tools within a CRM is your dashboards and these offer outstanding visibility and help support “why” with your sales team! In my experience CRM success and visibility comes from creating a dashboard that is your leading indicator and promoting this to your sales team as such. How are you managing your business? How do you know if you are reaching your sales goals? Most companies will answer, the back-end bookings and order history data. That’s good…keep doing it, but within CRM we can create what I call Load Input Goals. That’s where we’ll set up a formula to determine what kind of input do you need to reach your sales goals. There is a formula that I use and we can imbed that into the CRM and set up a dashboard to view that.
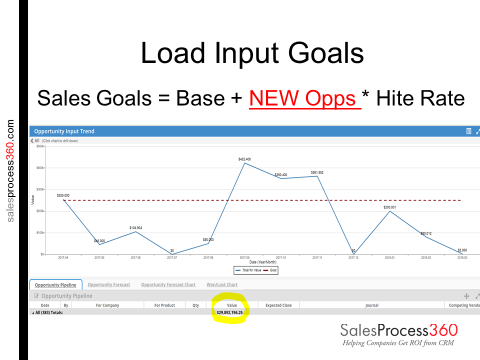
I am a huge believer on trending input…how old is the data in our pipeline? In the dashboard example above their total pipeline $ which is great to track, but that does not tell the entire story. The opportunity input trend show how the team is performing against Load Input Goal. If you are trending below the red line (Load Input goal) this is your leading indicator for future bookings. Let the sales team manage this! In doing this, you are giving them the tool to keep their eye on the ball. I believe it’s not just about “pipeline”, it’s managing the trend for the load input goal, I think a great dash board to manage from.
New Load Input vs. Pipeline:
Pipeline is NOT the same as New Load Input!
Pipeline = Total Open Opportunities
New Load Input = NEW Opportunity identified
Need to put focus on New Load Input #’s.
Sales Goals = Base Business + (NLI x Hit Rate)
*Hit rate is the moving target. I have asked a lot in the industrial market “what do you think the it is?” and I typically get an average of 25-35% as Hit Rate. So, if you really are not sure, start with that…it’s not an exact science.
You should be getting buy in from your salesforce if you work with them to come up with the Hit Rate. By doing this, you are giving them a tool to own and grade themselves. Get the sales team involved early in this! Allow them to have visibility of their business and drive it. During an association webinar a member offered this insight, “If the CRM dashboard and measurements aren’t treated in the same respect as your operational dashboard and KPI’s on a daily, weekly, and monthly basis you will not get out of it what you could”. I could not agree more! Visibility is a key component to success.
Be sure to visit our resources page for more information on “Load Inputs” and other valuable downloads. Sign up for our e-newsletter to receive blogs from the new series right in your inbox, and be sure to follow us on social media.